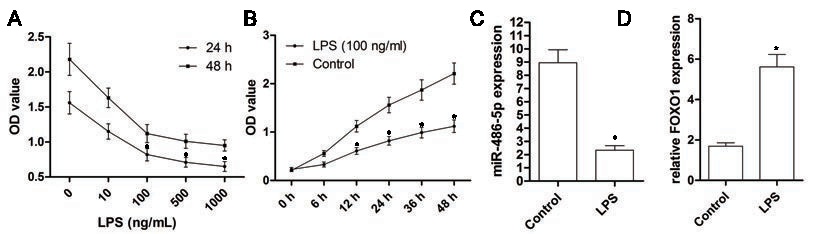
Fig. 1. LPS inhibits cell viability and miR-486-5p expression, and induces FOXO1 expression in NP cells. (A,B) After LPS (10, 100, 500, 1000 ng/ml) treatment, the viability of NP cells was measured by CCK-8 at 6, 12, 24, 36, 48 h, respectively. Equal amounts of normal saline (LPS, 0 ng/ml) were used as control. (C) miR-486-5p expression level was analyzed by qRT-PCR after the treatment of LPS (100 ng/ml, 24 h). (D) The expression level of FOXO1 protein was detected by Western blot. Each experiment was assayed in triplicate independently. Values were presented as means ± SD. *P<0.001, v.s. control.